One of the main reasons behind the rapid innovation and advances in data science has been the proliferation of open-source code-centric tools. This has allowed data scientists and software engineers to build powerful abstractions that make it really easy to analyze data.
For example, R packages like dplyr and tidymodels allow users to manipulate data and build sophisticated machine learning models with a few lines of code. Similarly, Python packages like tensorflow and pytorch allow anyone to build a deep learning model with little effort.
While code-driven tools have served data work well, the future of data work will be much broader, and involve graphical user interfaces (GUIs) that will let a broader audience engage in data science using point-and-click tools. Note that this does not by any means imply the death of the coding data scientist. Similar to the industrial revolution, this move will allow coders to redirect their focus to solving more complex problems, and building interfaces to tackle problems, leaving the domain-specific work to the domain experts. This is already happening across different slices of data work: descriptive, predictive, and prescriptive analytics.
Descriptive analytics is accessible with business intelligence
Descriptive analytics has been made accessible to a wider audience by the drag-and-drop business intelligence (BI) tools that are everywhere now. Just look at last year’s $2.6 billion acquisition of Looker, a very popular BI tool, by none other than Google. Also last year, Salesforce completed the acquisition of Tableau, another very popular BI tool. Microsoft has invested in its own tool, Power BI. (DataCamp offers courses on both Tableau and Power BI.)
Business intelligence tools make data discovery accessible for all skill levels—not just advanced analytics professionals. They are one of the simplest ways to work with data, providing the ability to collect data in one place, gain insight into what will move the needle, forecast outcomes, and much more.
How drag-and-drop interfaces reduce the barrier to entry for predictive and prescriptive analytics
The democratization of data work is evolving to also include predictive and prescriptive analytics. For example, Alteryx is a $10 billion dollar company that provides a drag-and-drop data science platform that allows business analysts to manipulate data and build predictive models using a drag-and-drop interface.
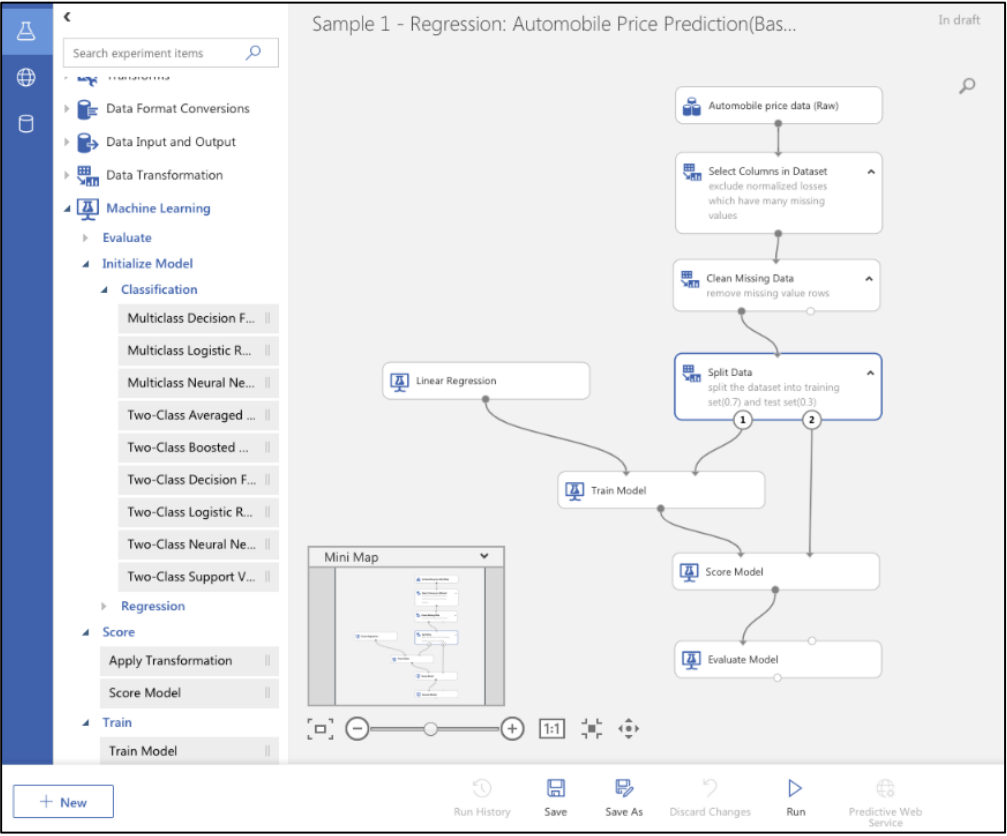
Google is investing a huge amount in their AutoML tool, which makes “AI as simple as drag and drop.” We see that Microsoft is also entering the space:
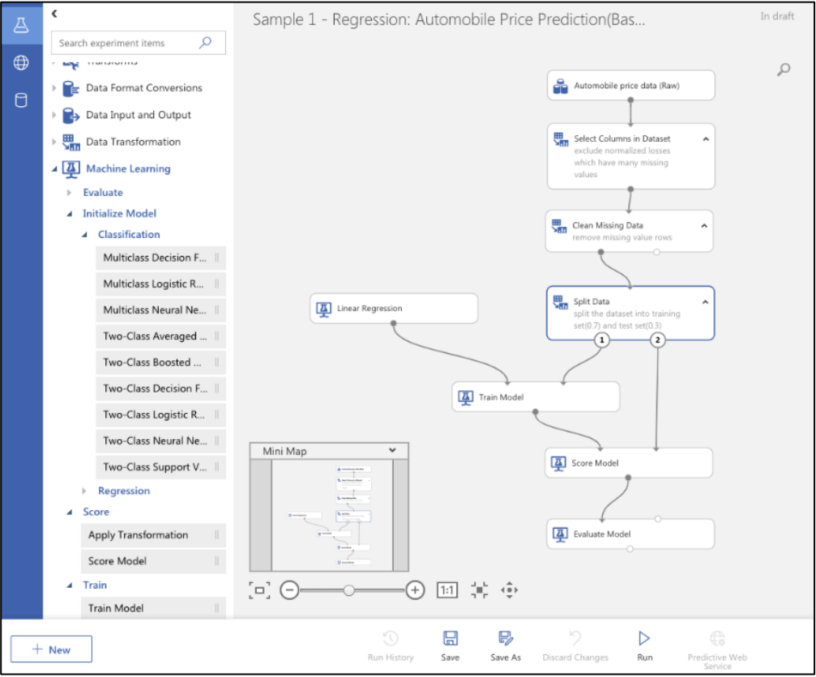
 Above is an example of a basic regression model with a data pipeline. You can see that the data flows from rectangle to rectangle. First data is ingested, then columns are selected, the data is cleaned, and the model splits and trains the data.
There are many potential use cases for drag-and-drop machine learning. This can be reframed as: what type of people in an organization would want to use ML tools that aren’t coders? Perhaps your customer success team wants to model customer churn. They’ll be able to do this using automated, drag-and-drop tools to forgo writing new models and new code every time a new customer comes in. Similarly, your Chief People Officer and HR team will be using more and more automated machine learning models in hiring flows, including screening resumes (we’ll get to the potential perils of this in a minute). And your marketing team may be interested in using such tools for the marketing funnel, which changed with the advent of ML tools for programmatic ad buying. One other telling example is supply chain optimization, which can greatly reduce costs within an organization and is relatively low-hanging fruit.
This trend can also be observed in complex spaces like deep learning. For example, Lobe is a startup that makes deep learning accessible to all, allowing users to build models using a GUI. Lobe was acquired by Microsoft even before they came out of a beta, which is testament to the importance of GUI tools in shaping the future.
Another example is an image search engine built by Google that lets medical doctors explore model predictions and fine-tune them further with human intelligence. Such tools can increase adoption with great effect by opening up the black box and supplementing ML models with human intelligence.
We’re going to see more drag-and-drop interfaces that will reduce the barrier to entry. This will allow us all to think more about which types of tools we want to build in-house and which ones we want to source from vendors.
Algorithmic marketplaces allow non-coders to purchase models
We’ll see more and more marketplaces for these ML products. Booz Allen’s Modzy is a point-and-click marketplace where you can buy models that others have created to incorporate into your tech stack.
There are dangers to allowing non-coders and non-statisticians to use these tools. Namely, we must ensure that everyone knows of the inherent risks associated with these tools and how to mitigate them. Increasingly, product development advancements in point-and-click tools may focus on helping people recognize when they’re given biased results, and not to take them at face value.
Beware of the danger zone of drag-and-drop ML
An interesting educational game out of Mozilla Labs is Survival of the Best Fit, about hiring bias in AI. You get to play a CEO who attempts to scale the hiring process with an automated tool that causes hiring practices to go wrong.
Recap
We’ll see more data work done in GUIs, via drag-and-drop and point-and-click interfaces. The space is getting more and more competitive with key investments by big players like Google and Microsoft, with much more to come. And even if a lot of your data science work is currently done in-house, more data work is increasingly shifting to vendors—which means there needs to be widespread education of potential risks and consequences to adopting AI.
Call to action
Write down how much of the day-to-day work in your organization currently happens in code. You could write this in human hours or how much it actually costs your organization. Then calculate how much is happening in GUIs, point-and-click, and drag-and-drop interfaces. How do you see this changing over the next 24 months?
Find out more about building your data program for the future of work in The Definitive Guide to Machine Learning for Business Leaders.

Content retrieved from: https://www.datacamp.com/community/blog/guis-and-the-future-of-work.


Leave a Reply